Can you imagine shipping a new user-facing dashboard only to have your users met with a visualization that takes several seconds or even minutes to load? No way, right? Your users would get frustrated by the opportunities missed, efficiencies destroyed, and decisions delayed based on outdated information and a horrible user experience.
Sadly, this is the status quo for many who build dashboards into their products. If you don’t know how to build real-time data architectures, you’ll be stuck with inefficient, legacy business intelligence platforms that can’t keep pace with user-facing features.
The contrast of this scenario with today's real-time analytics landscape couldn't be more stark, underlining just how vital it is to give your users immediate access to data analytics.

In this post, we're going to build real-time dashboards from scratch within a user-facing application. And we're not doing it the old-fashioned way, oh no! We're using some of my personal favorite tech out there: Tinybird, Tremor, and Next.js.
This post will walk through all of the steps to building a real-time dashboard using just these 3 tools. You can follow along here without any prior knowledge or resources, or if you’d like to work with and augment an existing project, you can clone this GitHub repo (which is the culmination of this guide, and then some).
In this post you'll learn to create a real-time dashboard from scratch (for free) using Tinybird, Tremor, and Next.js.
And by the way, you can do all of this for free. 🤑
Before we jump in, let’s talk about what we mean by a “real-time dashboard” and why most dashboards aren’t “real-time.” If you’re just here for the tutorial, you can skip ahead.
What is a real-time dashboard?
A real-time dashboard is an interactive real-time data visualization that displays continually updated metrics. It incorporates data that is just seconds old, refreshes almost instantaneously, and can support many concurrent viewers at once. Unlike traditional business intelligence dashboards that update on a periodic or batch basis, real-time dashboards pull in data as it is created, processed, or changed, providing an up-to-the-second snapshot of a system or process.

The primary components of a real-time dashboard include:
- Data Sources: The real-time feeds of information from various systems, services, and devices. Examples include sensor readings, user activity on a website, sales transactions, or social media interactions.
- Data Processing Engine: The system that aggregates, filters, and transforms the raw data from various sources into a format that can be consumed by a frontend application.
- Visualization Layer: The frontend app that brings the data to life through graphs, charts, maps, and other visuals. In a real-time dashboard, these visual components update near-instantaneously, reflecting the most current state of the data sources.
- Interactive Controls: Components by which users can interact with real-time dashboards, such as by adjusting filters, drilling down into detailed views, or setting alerts for specific conditions. These features empower users to explore data in more depth and respond to changes more swiftly.
Why are most dashboards slow?
Let’s be honest, most dashboards aren’t of the “real-time” variety. But why?
The problem is the underlying architecture and the manner in which the data is handled. Here are the main reasons that dashboards are slow:
- Batch ETL (Extract, Transform, Load) Processes: Many dashboards rely on batch ETL processes that collect, transform, and load data at specific intervals. These time-bound processes result in data that isn’t fresh. It doesn’t matter if a dashboard can refresh in 50 milliseconds if the data it’s showing is hours or days old.
- Complex Business Intelligence (BI) Tools: BI tools were designed for a small handful of users to run and visualize complex analytical queries over a database or data warehouse. While they are powerful for internal reporting and dashboarding, they tend to be slow. They’re not optimized for user-facing applications and often struggle with high query latencies and minimal user concurrency.
- Poorly Configured Data Stack: Most databases, data warehouses, and data processing layers aren’t optimized for real-time analytics. Things like inefficient indexing, row-based storage, improper data partitioning, and lack of in-memory processing can all cause bottlenecks in the data flow.
- Poorly Designed Queries: Inefficient or poorly constructed queries can significantly slow down data retrieval. Bad indexing, heavy joins, and full table scans all contribute to slow dashboards.
- Lack of Scalability: Real-time dashboards need to be able to scale with big data and with many concurrent users. A modern real-time dashboard must be built with scalability in mind to ensure that performance does not degrade as demand grows.
Most dashboards are slow because the underlying data pipelines are slow.
To build real-time dashboards, you need a real-time streaming data architecture. For more information on building such an architecture, read this post.
Tutorial: Building a real-time data analytics dashboard
Okay, so what are we building? Imagine you’re a DocuSign competitor. You’re building a SaaS to disrupt the document signature space, and as a part of that, you want to give your users a real-time data analytics dashboard so they can monitor how, when, where, and what is happening with their documents in real time.
We're building a real-time dashboard for a hypothetical DocuSign competitor.
Let’s build that dashboard.
To do so, we'll be using:
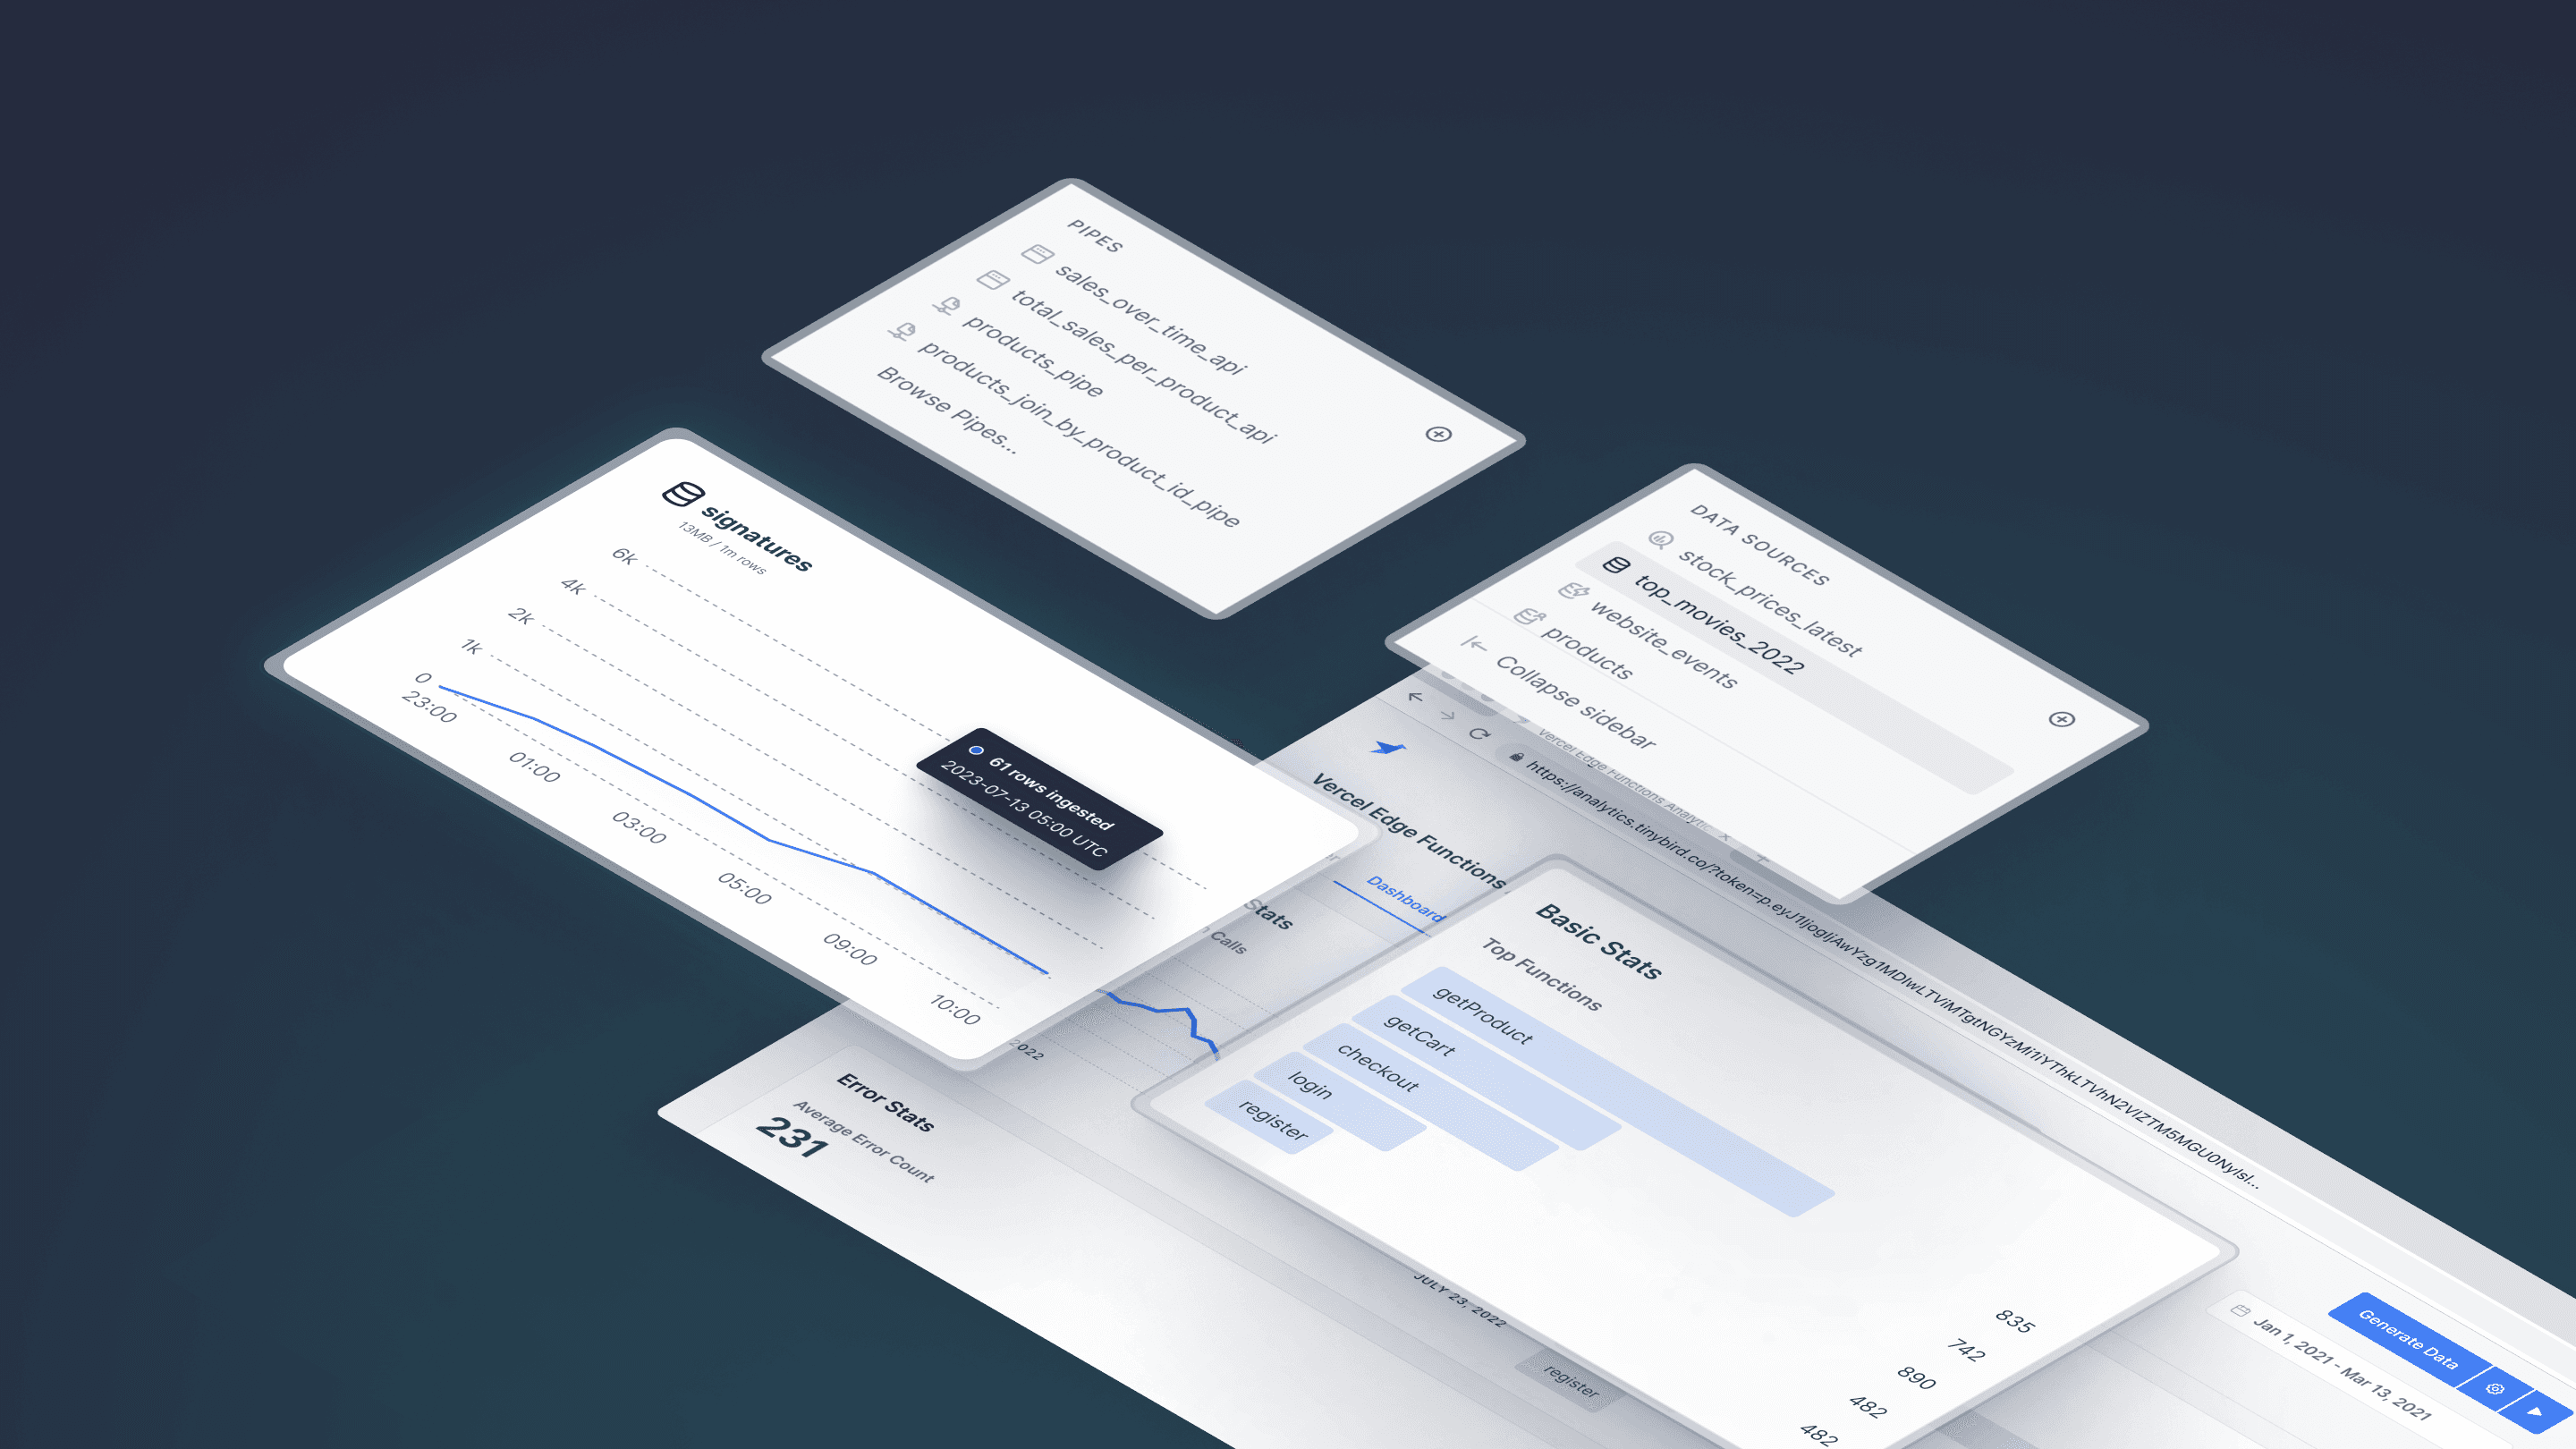
- Tinybird for real-time data ingestion, real-time data processing, and real-time APIs.
- Tremor components for the data visualization. It turns those numbers and statistics into something beautiful.
- Next.js as a fully-featured React framework. It ensures everything looks slick and runs smoothly.
The Tech Stack
Here's the flow of what we’re building today:
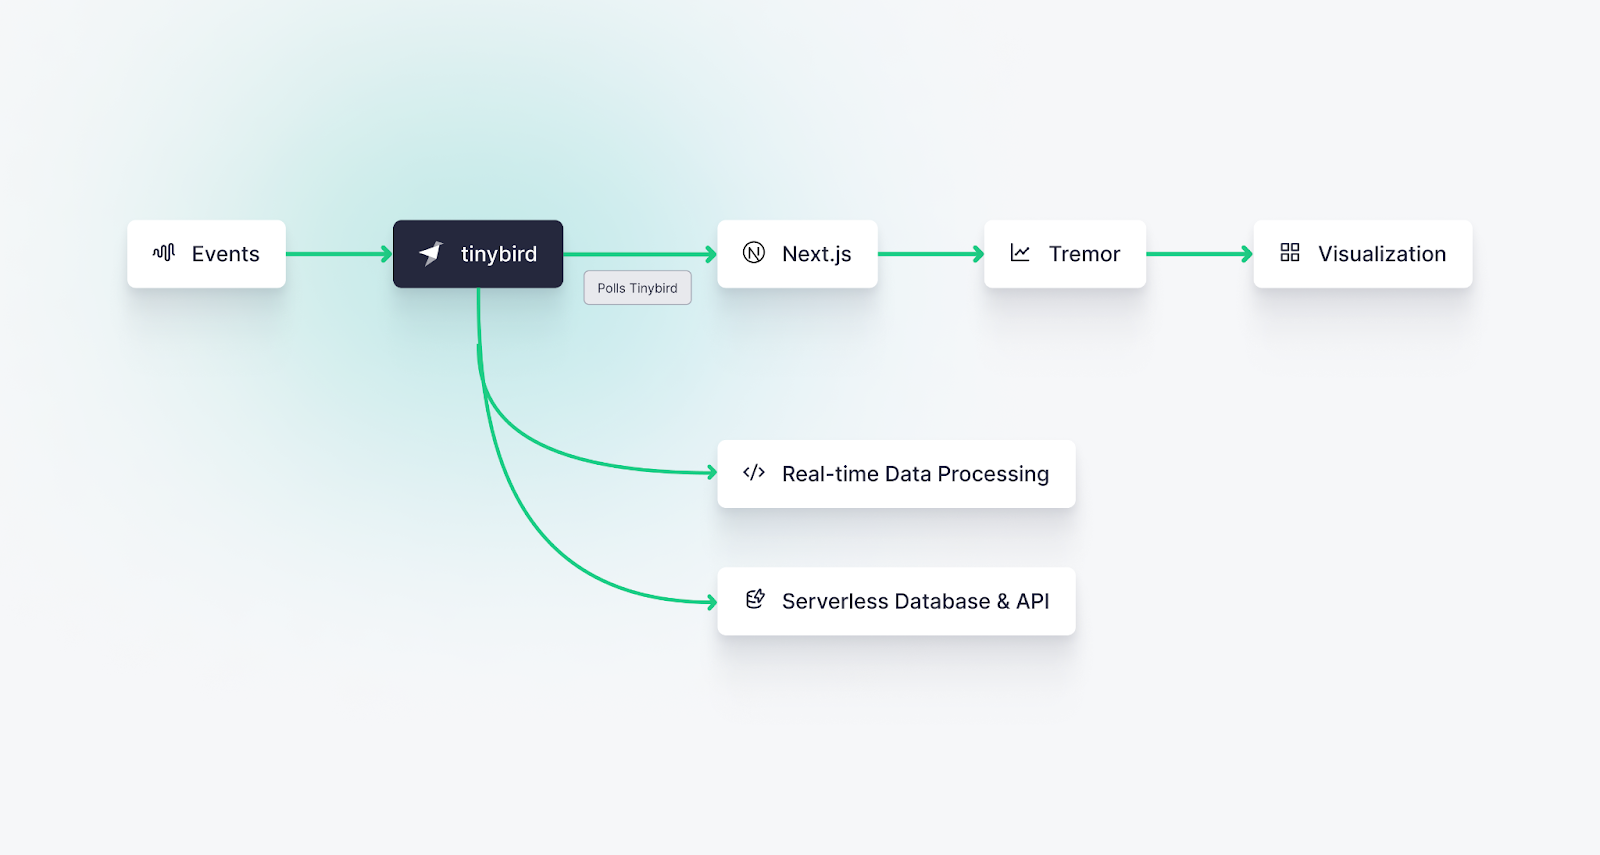
- Events (like a document being sent, signed, or received) will be sent to the Tinybird Events API, an HTTP streaming endpoint that captures events and writes them to a columnar base optimized for real-time analytics.
- Tinybird is a real-time data platform that we can use to build real-time metrics with SQL and instantly publish them as APIs.
- Tremor will then poll the API endpoints we publish in Tinybird and visualize the real-time metrics as beautiful visualizations.
- Next.js as a React framework for building our dashboard.
How to build a real-time dashboard from scratch
To build a real-time dashboard from scratch, you’ll follow these steps:
- Step 0: Install prerequisites
- Step 1: Create a mock data stream
- Step 2: Build dashboard metrics with SQL in Tinybird
- Step 3: Publish metrics as APIs using Tinybird
- Step 4: Create real-time dashboard components with Tremor and Next.js
Step 0: Install Prerequisites
Before you get started, you’ll need to have the following prerequisites installed:
- Node.js (version 18 or above)
- Python (version 3.8 or above)
For information on installing those, check out their docs: Node.js and Python.
Initialize your Next.js project
Once you have those installed, create a new Next.js app. In this demo, I’ll be using plain JavaScript files (no TypeScript) and Tailwind CSS.
When prompted, select “Yes” for App Router and "No" to customizing the default import alias
Next, create some folders in your Next.js project. We’ll use these for the Tinybird resources we create later.
Create a Tinybird account
Tinybird is the real-time data platform that underpins our real-time dashboard. If you’re new to Tinybird, create a free account here.
Install the Tinybird CLI
The Tinybird CLI is a command-line tool that allows you to interact with Tinybird’s API. You will use it to create and manage the data project resources that underpin your real-time dashboard.
Run the following commands to install the Tinybird CLI (from the tinybird/ directory) and log in:
When you log in, you'll be prompted to select a region to host your data project. This will open a browser window for you to sign in and either select an existing workspace or create a new one in that region. Once you've completed that step, your CLI will be authenticated, and your auth details will be saved in a .tinyb file in the current working directory. You can logout at any time with tb logout.
Start the Tinybird local container
You can run Tinybird locally on your machine to test and validate your build before deployment. You'll need a container runtime like Docker Desktop or Orbstack, then start the local container:
Step 1: Create a data source to store events
In Tinybird, a data source is defined by a database table and, optionally, a connection to an external source of data.
In this demo, we'll simply be generating some mock data using the Tinybird CLI. If you need more info on how to get data into Tinybird, check out these docs.
There are a few ways to create a data source in Tinybird:
If you have an existing data file
If you have sample data stored in a file (CSV, NDJSON, Parquet), you can create a data source with a matching schema with the following command:
When you use the tb create command, Tinybird will go ahead and scaffold your data project, generating all the necessary directories along with a few other utilities (CI/CD workflow config files, .cursorrules, etc.)
Using LLMs
If you don't have an existing source of data, you can simply use a prompt:
If you use the LLMs feature, Tinybird will create a file with a few rows of mock data and store it in the fixtures/ directory.
Manually
Alternatively, you can create a data source manually by defining a schema (or by starting with a prompt and modifying the result). Here's the signatures.datasource file we're using in this demo:
Note that this demo also includes an accounts.datasource, so if you're following along, go ahead and download that too.
Step 2. Create API endpoints with Tinybird pipes
The next step is to build real-time metrics using Tinybird pipes.
In Tinybird, a pipe is a set of chained, composable nodes of SQL that process, transform, and enrich data in your data sources. Pipes can be deployed as API endpoints, materialized views, or copies.
Here's why you’ll love Pipes:
- Performance: Pipes process new data in real time, allowing for rapid transformations on streaming data sets.
- Flexibility: Pipes let you define custom data processing flows using filters, aggregations, and joins, enabling complex analytics and insights.
- Scalability: Pipes can handle massive volumes of data, scaling with your needs.
- Ease of Use: Pipes break up larger SQL queries into manageable nodes, which makes it easier to prototype, debug, and identify performance bottlenecks.
- Maintainability: Pipes organize the data workflow intuitively, making it easier to understand and modify.
Creating a pipe is much like generating a datasource:
Of course, you can modify the .pipe file as needed, or generate it manually.
Making your queries more dynamic
Depending on the pipe file you generated, your SQL may use static date range filters, but as I described earlier, real-time dashboards should be interactive. Instead of hardcoding the date range, we want our users to be able to select a dynamic range and have the results refresh in real time.
You can do this in Tinybird with its templating language, which lets you define dynamic, typed query parameters as well as add custom logic such as if/else statements and more.
Take a look at the SQL below using the Tinybird templating language. Note a couple of things:
- The
if definedstatement. This clause tells the pipe to execute the statements only if a certain parameter is passed. In this case, I’ve created logic such that if a boolean tag calledcompletedis passed, the pipe calculates the number of completed signatures. Otherwise, it calculates all signatures. - Added
date_fromanddate_toquery parameters (Datetype), which will dynamically change the filter based on the date values passed.
Here's the final endpoint pipe we'll use in this demo:
This is a 2-node pipe that gets the top <limit> organizations by signatures within a date range, either completed or total depending on whether you pass a completed query parameter.
Make sure to name this pipe file ranking_of_top_organizations_creating_signatures.pipe if you're following along.
Step 3: Test the build locally
At this point, your Tinybird project should look something like this:
You can build the project on Tinybird local for testing. There are two ways to do this:
tb build is a stateless command that checks syntax validity on your .datasource and .pipe files. You can optionally run tb build --watch (or its alias tb dev), which will build the files and watch for changes. This is great when you're actively building and want to validate changes.
This command deploys your project to the Tinybird local container. This can be good for testing when you don't want to maintain a stateless dev server in your terminal, but keep in mind that if you make changes to your files, you'll have to redeploy.
Step 4 (Optional): Generate more mock data for local testing
If you’re building a real-time data dashboard using existing data streams, then you won’t necessarily need to follow this step. But since I’m building a dashboard for a hypothetical document signature SaaS, I’ll need some mock data to work with!
In the past, you used to have to build a custom datagen script to get realistic(ish) mock data. In fact, there's a legacy datagen script in this repo. But we don't need that anymore. Now, you can just use tb mock.
To generate some fake data for local testing (on top of the small set of data generated during create), run the following:
This generates mock data that matches the schema for each data source. You can specify the number of rows to generate, and add a prompt for more specific instructions.
This command generates both an NDJSON fixture file and an SQL file (which is used to generate the mock data on the local database). You can make tweaks to the SQL file to generate a more precise mock data fixture.
Note that if you run tb mock inside of the tb dev console, the project will automatically rebuild. However if you're testing on a local deployment you may need to redeploy to local after you generate a new fixture.
To verify that your local data sources have mock data, you can query them:
This will return the current number of rows in the signatures Data Source. If you’re mock data creation is working (and still running in the background), you’ll see that number tick up.
Step 5: Test your APIs
Your real-time dashboard will need an API (Application Programming Interface) to ensure seamless integration, accessibility, and interaction with other applications or services.
Here's why real-time APIs are so important for fast dashboards with many users:
- Integration & Interoperability: APIs allow your dashboard to be accessed programmatically by other applications. This enables a more comprehensive integration with different platforms, tools, or third-party services.
- Scalability: Through APIs, the dashboard can be quickly and easily scaled to serve multiple clients, including web, mobile, or IoT devices. This ensures that as your needs grow, your architecture can adapt without major redesigns.
- Real-Time Data Access: If your dashboard relies on real-time or frequently updated data, APIs are essential for providing up-to-the-minute access to the information, enhancing decision-making and user experience.
With Tinybird, your endpoint pipes are automatically deployed as low-latency, high-concurrency REST APIs. You can secure your APIs with static tokens or JWTs.
Now let’s test your new API.
You can get the URL of your local API:
That should give you something that looks like this:
Within the endpoint URL, you will notice the date_from and date_to parameters. These control the date range for the query, and they can be modified to filter the results accordingly. You’ll also see the limit parameter, which controls how many rows are returned.
Fetch that with a curl or in your browser to get the results of your API deployed locally
Try altering the values for these parameters in the browser's address bar. As you change the dates or limit and refresh the page, you should see different data returned in response to your query. This behavior verifies that the dynamic filtering is working correctly, allowing the query to adapt to different user inputs or requirements.
If you request the data in a JSON format, you’ll also receive some metadata about the response, including statistics about the query latency:
In the above example, the API response took barely 1 millisecond, which is a recipe for fast dashboards! You can utilize this metadata to continue to monitor your dashboard query performance and optimize as needed.
Step 6: Create real-time dashboard components with Tremor and Next.js
Now that you have a low-latency API with real-time dashboard metrics, let’s create the visualization layer using Next.js and Tremor. These two tools give us a scalable and responsive interface that can effectively integrate with Tinybird's APIs to display data dynamically.
Here's how you can get started:
Add Tremor to your Next.js app
We’re going to use Tremor to create a simple bar chart that displays the signature count for each organization. Tremor gives you beautiful React chart components that you can deploy easily and customize as needed.
Start by installing Tremor with the CLI:
Select Next as your framework and allow Tremor to overwrite your existing tailwind.config.js.
Set up environment variables
Next, you need to add your Tinybird host and admin token as environment variables so you can run the project locally. Add the following to your .env.local file:
Note, you'll need to have a read token for your API if you don't already. To create one just run:
Set up your index.js
Let’s create an index page to build and display our real-time dashboard. Note that you could very easily "vibe code" this with an AI-assisted IDE, but for the sake of completeness I'll walk you through it.
Next.js may have made a default index.js, in which case, start by clearing its contents.
Import UI libraries
To build your dashboard component, you will need to import various UI elements and functionalities from the libraries provided. Make sure you have the following libraries and components imported at the beginning of your file:
Define constants and states
Inside your main component, define the constants and states required for this specific component. We’re going to set the state for the chart data and the latency of the query (so we can see how fast this dashboard is!):
Connect your dashboard to your Tinybird API
You’ll need to write a function to fetch data from Tinybird. Note that for the sake of brevity, we are hardcoding the dates and using the default limit in the Tinybird API. You could set up a Tremor datepicker and/or number input if you wanted to dynamically update the dashboard components from within the UI.
Configure the Tinybird API Call
You need to define the specific URL for the Tinybird API call and make the fetch request using the fetchTinybirdUrl function inside the useEffect hook:
Render the Component
Finally, include the rendering code to display the "Ranking of the top organizations creating signatures" in the component's return statement:
To view your real-time dashboard component, run the following:
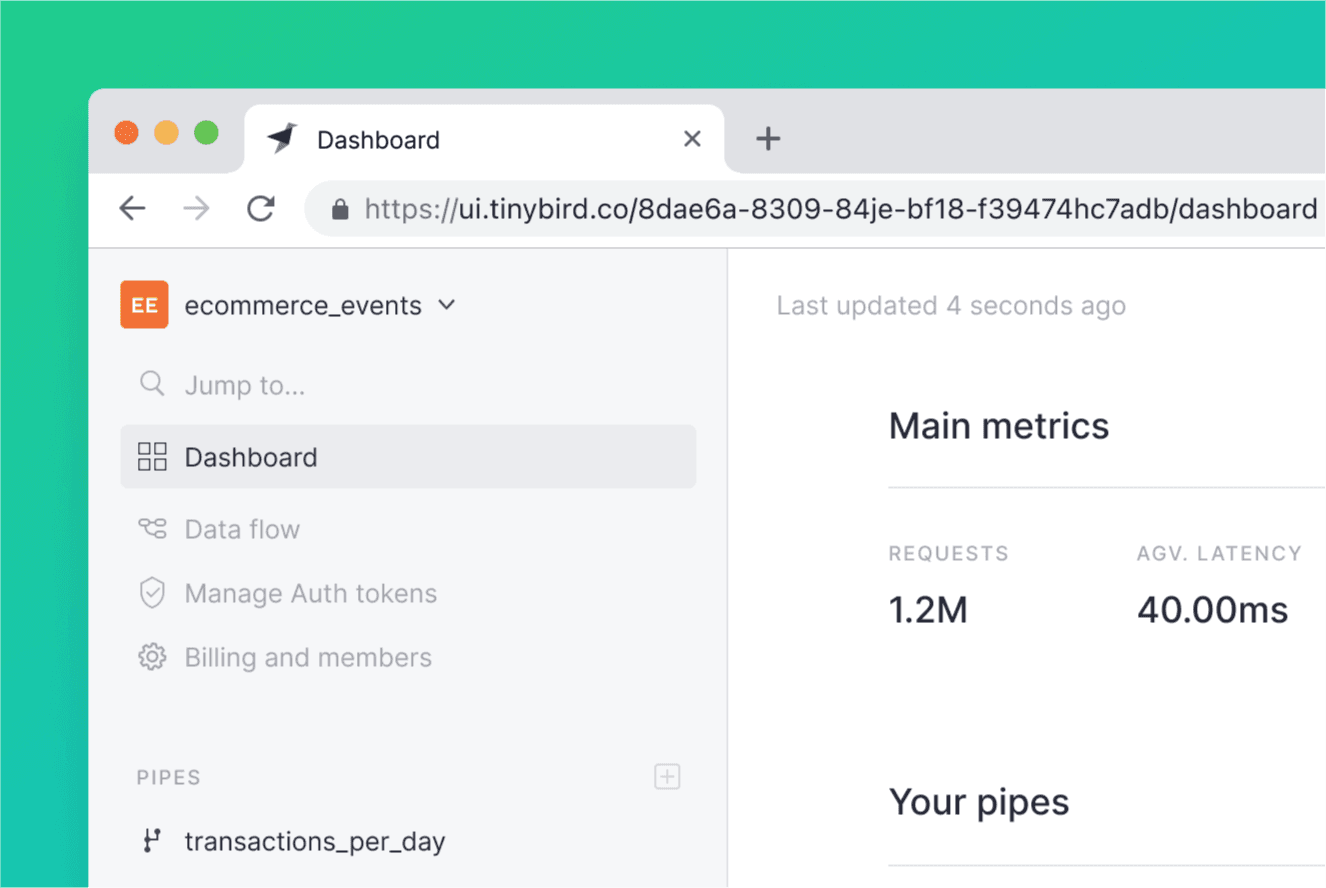
Navigate to http://localhost:3000/ in your browser. You should see something like this:
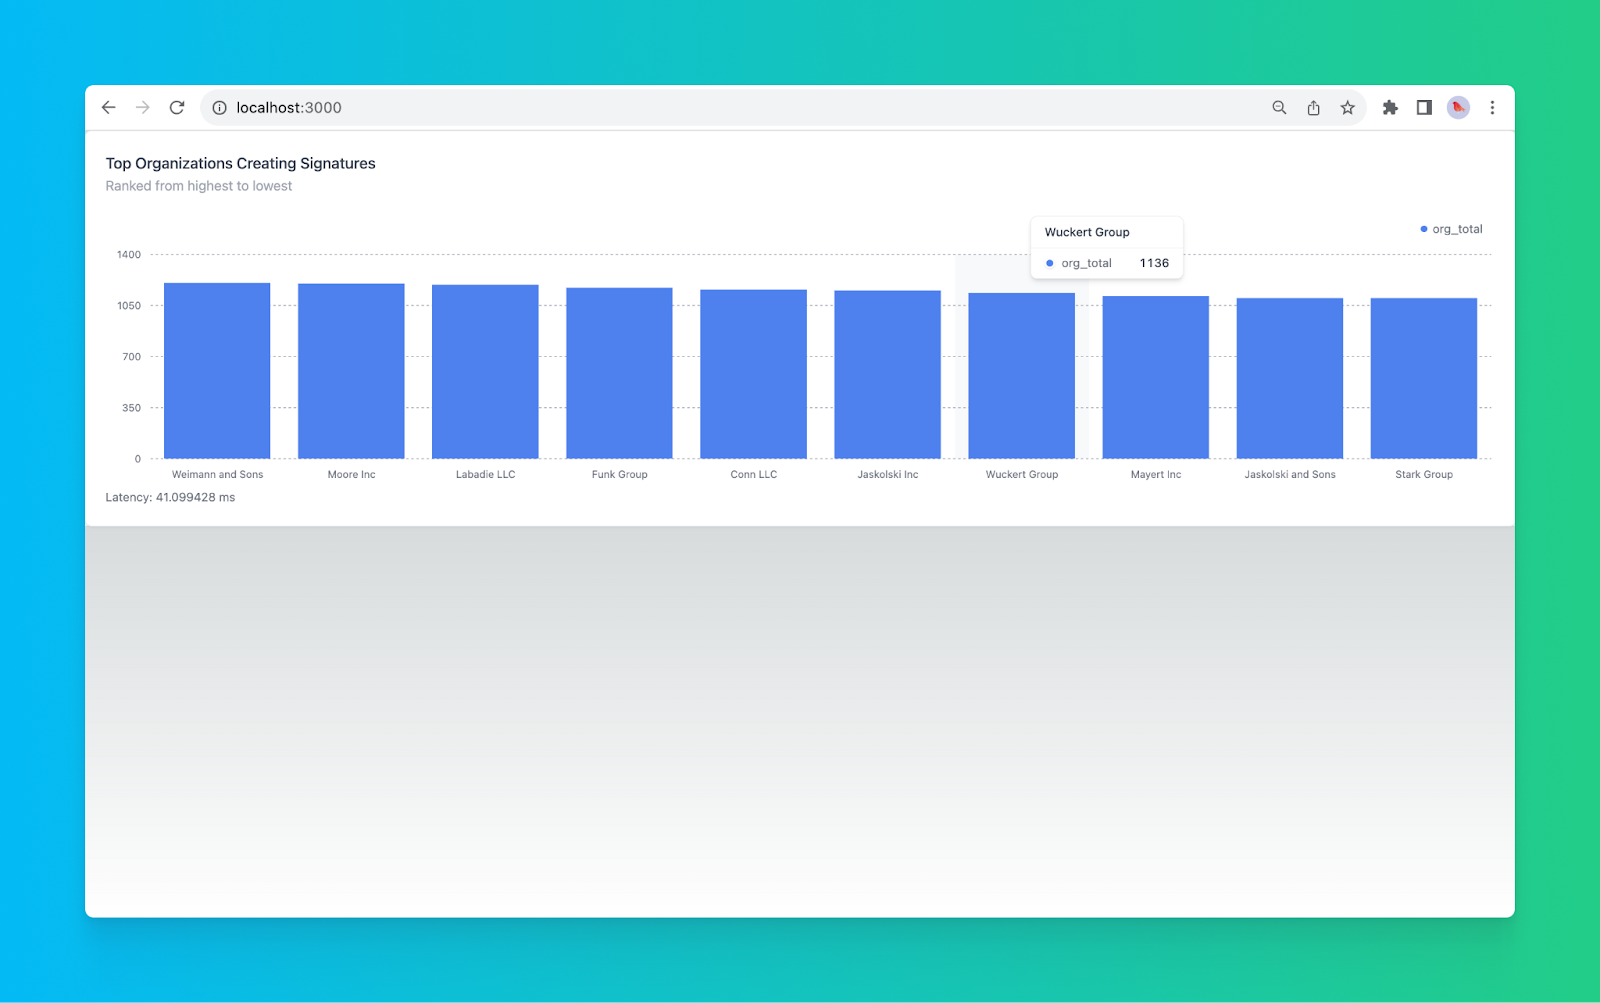
And that’s it! You’ve created a real-time dashboard component using Tinybird, Tremor, and Next.js. You’ll notice the dashboard is rendering very quickly by taking a peek at the latency number below the component. In my case, Tinybird returned the data for my dashboard in a little over 40 milliseconds aggregating over about a million rows. Not too bad for a relatively unoptimized query!
Step 7: Deploy it
Once you've validated your local build, you can deploy it to the cloud.
To deploy your Tinybird data project, you have two options:
Manually:
Or in CI/CD:
Tinybird automatically generates CI/CD config files for GitHub and GitLab. If you want to run deployments as a part of your git workflow (so you can deploy Tinybird alongside your app), you just need to add your Tinybird host and token as secrets in your git provider and modify the .yaml files as needed for your workflows. More info on deploying Tinybird in CI/CD.
Next Steps
This tutorial showed you how to build a single real-time dashboard component, but you probably want to add additional components and interactive elements.
If you need ideas, check out the GitHub repository for this project.
You can also spend some time optimizing your data project for faster responses and minimal data processing using fine-tuned indexes, Materialized Views, and more. For tips on optimizing SQL queries or building Materialized Views, check out the Tinybird docs.
Wrapping up
If you are interested in building real-time dashboards or any other real-time visualizations, you need a data stack and frontend library that can keep pace. In this tutorial, you learned how to use modern tooling to build an end-to-end real-time data pipeline and dashboard. With Tinybird, Tremor, and Next.js, it’s possible to build a real-time dashboard from scratch in less than an hour.
The combination of Tinybird, Next.js, and Tremor provides a powerful solution for building real-time dashboards, but the real “speed layer” here is Tinybird. Here’s what Tinybird is perfect for building real-time data visualizations:
- Real-Time Data Ingestion and Processing: Tinybird can handle large streams of data in real time. Unlike traditional batch ETL processes, it can ingest, process, and analyze millions of events per second on the fly. This means that your dashboard can reflect changes almost instantly, keeping the insights fresh and timely.
- Highly Optimized Query Engine: Tinybird’s query engine is built to execute complex analytical queries in milliseconds. It can handle filtering, aggregating, or joining data without breaking a sweat, which means your dashboards won’t experience lagging refresh times.
- Scalable Architecture: Tinybird is a scalable, serverless real-time data platform. It flexibly scales storage and compute resources based on demand. As your data volumes and user loads increase, Tinybird responds to ensure fast dashboards at scale.
- Integration with Streaming Sources: Tinybird includes many first-class connectors for streaming data sources (like Apache Kafka, Google Pub/Sub, Amazon Kinesis, and more), so you can unify data from multiple sources directly into your visualization layer.
- Real-time API Publication: Tinybird is designed specifically for user-facing applications. With Tinybird, you can instantly publish SQL-based metrics as APIs that you can integrate into your frontend.
- Compatibility with Next.js and Tremor: Tinybird's architecture and API are designed to work seamlessly with modern frontend frameworks like Next.js and visualization tools like Tremor. This integration creates a smooth user experience from data ingestion to visualization.
- Easy to Use: Even with all its robust capabilities, Tinybird remains accessible to developers. Its simplified SQL-based query language and well-documented APIs mean that building and maintaining a real-time dashboard does not require specialized skills or extensive training.
If you're dabbling in real-time data processing or looking to shift to event-driven architectures for your dashboards, Tinybird could be for you. It's free to start and designed to help you build real-time data pipelines fast. You can sign up here (no credit card required!)
Stuck somewhere along the way? Join the Tinybird Slack community for help. Want to dive deeper into Tinybird? The Tinybird docs are a great place to start.
Additional Resources
FAQs
What are the technologies used for creating a real-time dashboard, and why?
The application uses Tinybird for real-time data ingestion and real-time analytics, Tremor for data visualization, and Next.js as a fully-featured React framework. These technologies are chosen for their efficiency in processing large streams of real-time data, visualizing it in a user-friendly way, and ensuring a smooth and visually appealing rendering.
What makes Tinybird essential for real-time data handling in the tech stack?
Tinybird provides real-time data ingestion and processing, optimized query execution, scalable architecture, compatibility with streaming sources, integration with modern frontend frameworks, and accessibility to developers. Its architecture is tailor-made for real-time analytics dashboards, making it an essential part of this process.
How can I set up the Tinybird CLI?
Install the Tinybird CLI with curl -L tinybird.co | sh
Why are most data dashboards slow, and how does this application overcome that?
Traditional dashboards are slow due to issues like batch ETL processes, complex BI tools, heavy data stack, poorly designed queries, and lack of scalability. By using Tinybird, Next.js, and Tremor, this application overcomes these issues with real-time processing, optimized queries, and scalable architecture.
What are the primary components of a real-time dashboard?
A real-time dashboard consists of Data Sources, a real-time data processing engine, a real-time visualization layer, and interactive controls. They collectively provide an up-to-the-second snapshot of critical metrics and KPIs, allowing users to interact with the data and gain insights instantly.
Can the structure described in the post be applied to other use cases besides signatures?
Yes, the structure and technologies can be adapted to almost any use case that requires real-time data handling, making it highly versatile.
What precautions should be taken with Tinybird authentication tokens?
The admin token should be kept secure and not shared or published. It's essential to hide secrets by adding the Tinybird config file to the .gitignore file, ensuring that it won't be committed to the repository.